Building Flakes's DevTools: A Journey in AI-Assisted Native Development
Why Developer Tools Matter
Every web developer knows the ritual: right-click, “Inspect”, and suddenly you’re in the most powerful debugging environment ever built. Chrome DevTools is perfect—comprehensive, fast, and intuitive. It’s the gold standard.
Safari’s Web Inspector? Let’s just say there’s a reason developers groan when debugging Safari-only issues. The UX feels dated, the workflow is clunky, and it requires opening a separate app.
When building Flakes, a native macOS browser, I faced a choice: rely entirely on Safari’s Web Inspector via isInspectable, or build something purpose-built for our users.
I chose both—but the journey to our own DevTools taught me invaluable lessons about AI-assisted development.
It Started with Console.log
The first DevTools feature was born from frustration. While developing Flakes itself, I needed to debug JavaScript injected into web pages—console interceptors, link hints, form focus detection. Opening Safari’s Web Inspector every time was friction I didn’t want.
So I built a simple console panel. JavaScript’s console.log, warn, error, and table methods get intercepted and forwarded to native Swift via WKScriptMessageHandler. A clean SwiftUI view displays them with proper formatting and filtering.
// ConsoleInterceptor.js - captures all console methods
['log', 'warn', 'error', 'info', 'debug', 'table'].forEach(method => {
  const original = console[method];
  console[method] = function(...args) {
    window.webkit.messageHandlers.consoleMessage.postMessage({
      type: method,
      args: args.map(formatArg)
    });
    original.apply(console, args);
  };
});
Lightweight. Fast. Always available with ⌘⌥I. No Safari required.
“I Can’t See the HTML”
One day, debugging a rendering issue, I instinctively pressed ⌘U to view page source. Nothing happened.
We don’t have that.
This realization sparked a deeper question: what’s the minimum viable DevTools for a modern browser? View Source seemed obvious—every browser since Netscape has it.
The Source Viewer Architecture Journey
This is where AI-assisted development truly shines—and where experienced judgment becomes critical.
Attempt 1: SwiftUI Text (Naive)
My first instinct: fetch the HTML string, display it in a SwiftUI Text view with syntax highlighting via AttributedString.
// Don't do this
Text(AttributedString(highlighting: htmlSource))
    .font(.system(.body, design: .monospaced))
The result? Memory exploded. A 163KB HTML page consumed hundreds of megabytes in attributed string processing. SwiftUI’s text rendering isn’t designed for code editors.
Attempt 2: File-Backed Storage
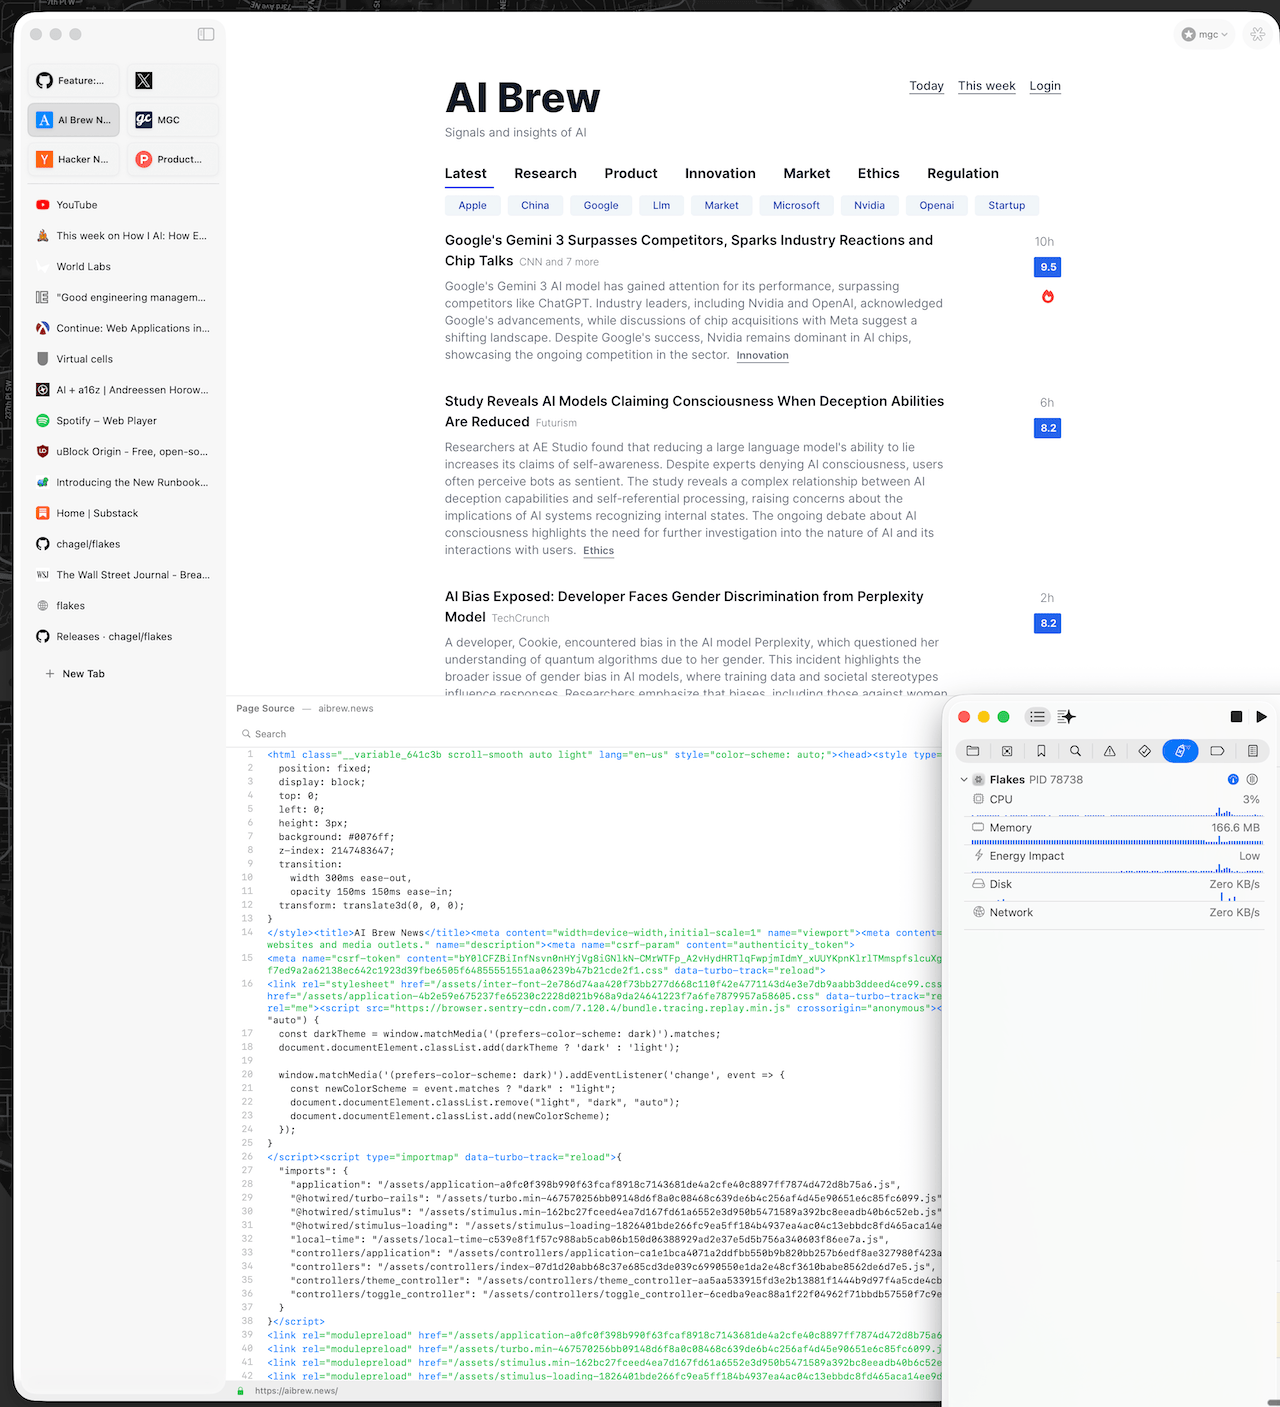
“Maybe the problem is keeping it all in memory,” I thought when I noticed the memory spike in Xcode. I know there are much for memory optimization. Claude’s code is just a standard sloppy. I already had the ideas use temp files, lazyvstack and LRU caching. I saved the HTML to a temporary file and used lazy loading.
Better, but syntax highlighting still required loading everything into memory for AttributedString processing. The fundamental approach was wrong.
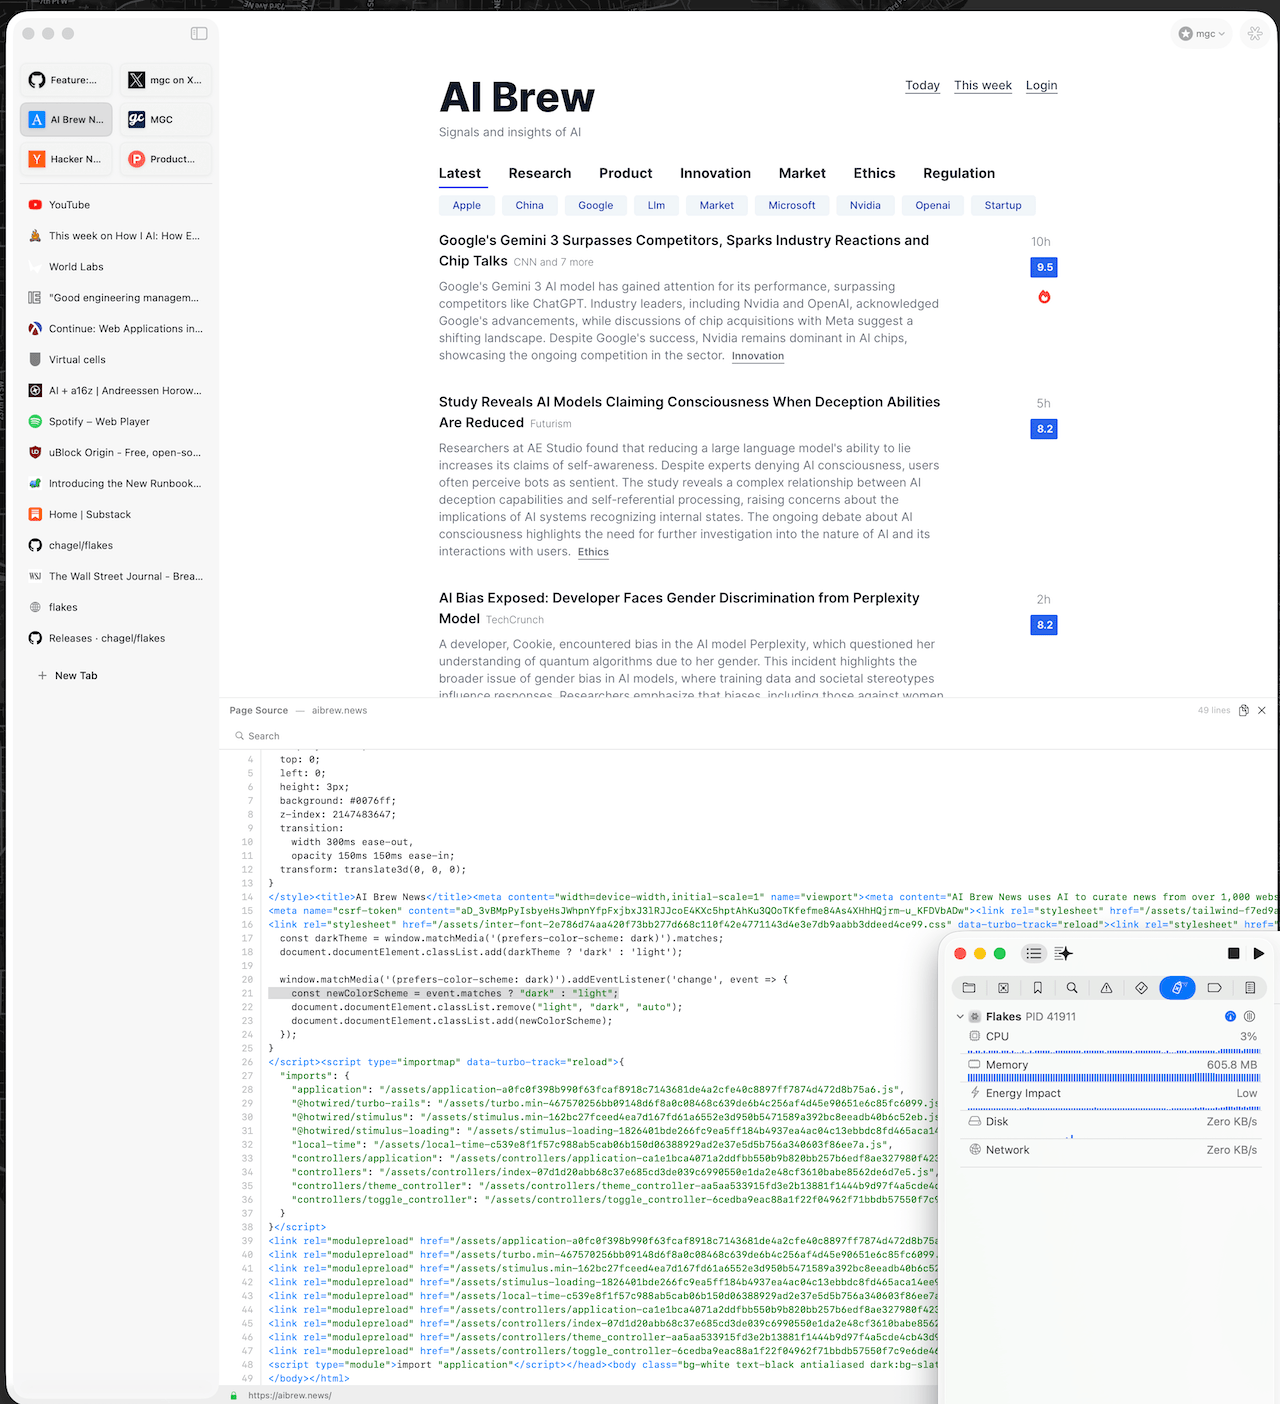
Attempt 3: WebView + highlight.js (Current Solution)
Then the insight: we’re already experts at rendering HTML—we’re a browser!
The solution: render the source code as an HTML page, using https://highlightjs.org/ for syntax highlighting. The source viewer is itself a WKWebView displaying:
<!DOCTYPE html>
<html>
<head>
  <link rel="stylesheet" href="github.min.css">
  <script src="highlight.min.js"></script>
</head>
<body>
  <pre><code class="language-html">
    <!-- escaped HTML source injected here -->
  </code></pre>
  <script>hljs.highlightAll();</script>
</body>
</html>
Memory usage: stable at ~50MB regardless of source size. highlight.js handles 163KB files instantly. Dark/light themes switch automatically.
Other Options Considered
- TreeSitter: Powerful incremental parsing, but overkill for read-only source viewing and adds significant complexity
- NSTextView: AppKit’s text system is more efficient than SwiftUI’s, but we’d still face syntax highlighting challenges
- Custom syntax parser: Maximum control, maximum effort—not worth it for this feature
The AI-Assisted Insight
This is the heart of modern development with AI. I described each approach to Claude, including the memory issues. The AI suggested the WebView approach, but I made the decision—because I understood:
- We already have WKWebView infrastructure
- highlight.js is battle-tested (used by GitHub, Stack Overflow)
- Local bundling eliminates CDN latency
- The browser-in-browser irony is actually elegant
Experienced developers bring instinct about limits. AI brings breadth of options. Together, you navigate tradeoffs efficiently.
The Unified DevTools Panel
With Console and Source working, the natural evolution was a unified panel—tabbed, resizable, docked to the bottom like Chrome DevTools.
struct DevToolsView: View {
  @Environment(DevToolsModel.self) private var devTools

  var body: some View {
    VStack(spacing: 0) {
      // Resize handle
      ResizeHandle()

      // Tab bar
      HStack {
        ForEach(DevToolsTab.allCases, id: \.self) { tab in
          TabButton(tab: tab, badge: badgeCount(for: tab))
        }
      }

      // Content
      switch devTools.activeTab {
      case .console: ConsoleContent()
      case .source: SourceContent()
      case .network: NetworkContent()
      case .elements: ElementsContent()
      }
    }
    .frame(height: devTools.isMaximized ? .infinity : devTools.panelHeight)
  }
}
SwiftUI made this trivial. The declarative nature means adding a new tab is just adding a case to the enum and a view to the switch.
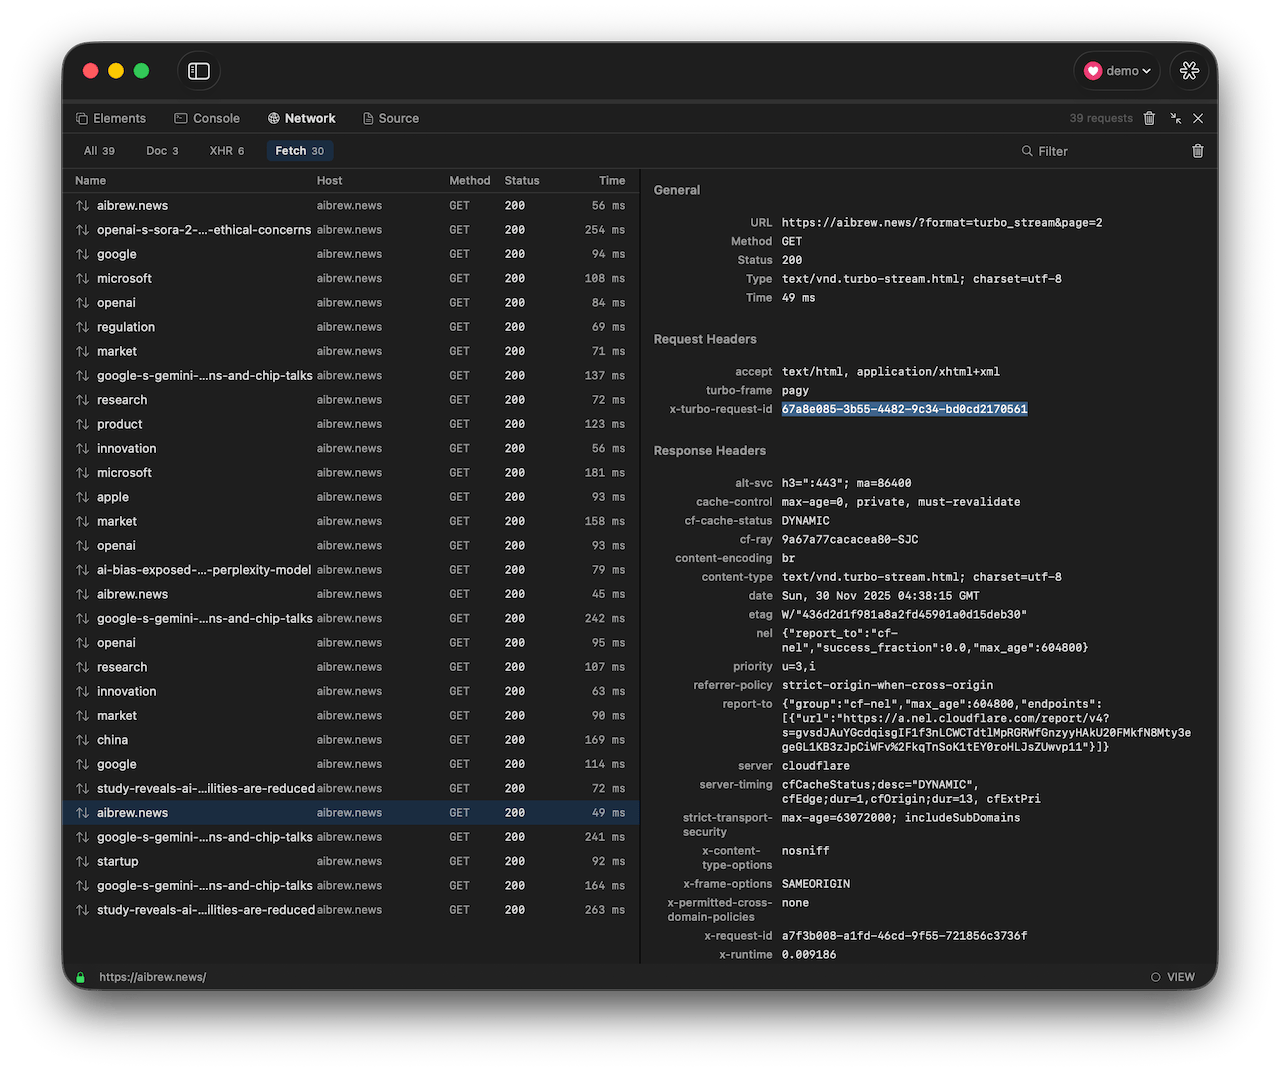
Network Panel
Frontend developers live in the Network tab. “Why is this API slow?” “Did the request even fire?” “What headers are being sent?”
Our implementation intercepts both JavaScript-initiated requests and document navigations:
JavaScript (XHR/Fetch):
// NetworkInterceptor.js
const originalFetch = window.fetch;
window.fetch = async function(url, options) {
  const startTime = performance.now();
  const requestId = generateId();

  postMessage('networkRequest', { id: requestId, type: 'fetch', url, method: options?.method || 'GET', status: 'pending'
});

  try {
    const response = await originalFetch(url, options);
    postMessage('networkRequest', { id: requestId, status: response.status, duration: performance.now() - startTime });
    return response;
  } catch (error) {
    postMessage('networkRequest', { id: requestId, status: 'error', error: error.message });
    throw error;
  }
};
Document Navigations (Native):
// WKNavigationDelegate
func webView(_ webView: WKWebView, decidePolicyFor navigationResponse: WKNavigationResponse) {
  if let httpResponse = navigationResponse.response as? HTTPURLResponse {
    NetworkModel.shared.updateRequest(url: httpResponse.url, status: httpResponse.statusCode)
  }
}
Features we considered essential from frontend experience:
- Filter by type (XHR, Fetch, Document)
- Status code coloring (green 2xx, red 4xx/5xx)
- Duration timing
- Request/response size
- Host column for identifying domains
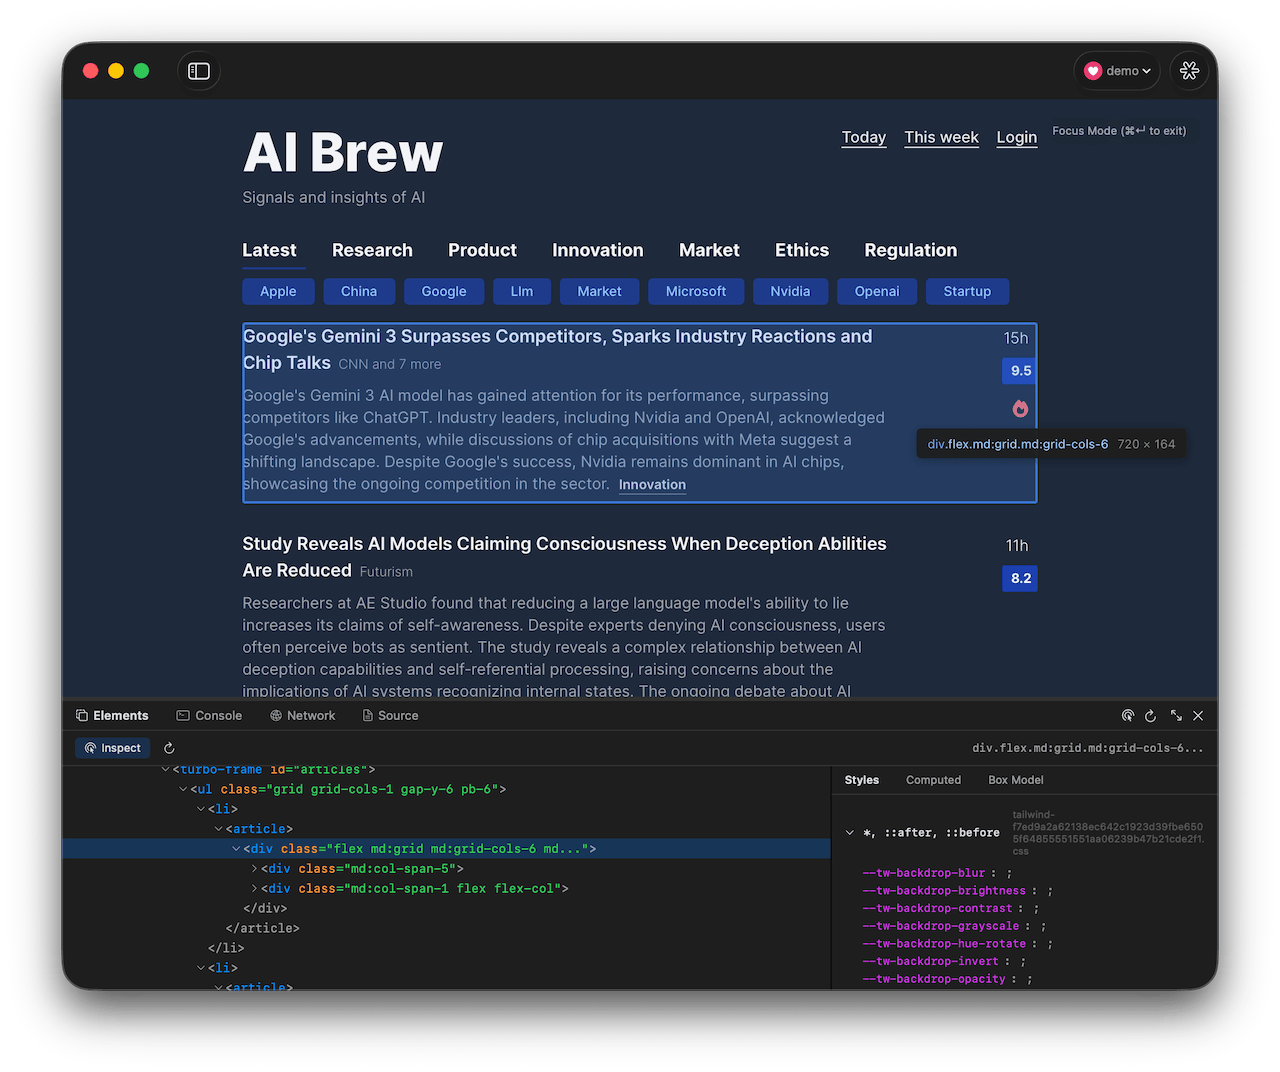
Elements Inspector
The Elements panel was the most ambitious. A live DOM tree viewer with:
- Expandable/collapsible nodes
- Click-to-highlight (select in tree → highlight on page)
- Click-to-inspect (click on page → select in tree)
- Styles panel (inline styles, matched CSS rules)
- Computed styles grouped by category
- Visual box model diagram
The DOM extraction happens via JavaScript injection:
function extractDOM(element, depth = 0, maxDepth = 30) {
  if (depth > maxDepth) return null;

  return {
    id: getElementId(element),
    tagName: element.tagName.toLowerCase(),
    attributes: getAttributes(element),
    children: Array.from(element.children).map(child =>
      extractDOM(child, depth + 1, maxDepth)
    ).filter(Boolean)
  };
}
The highlight overlay uses a positioned div that follows the selected element’s bounding rect—updated on scroll and resize.
The macOS + SwiftUI + Claude Code Stack
Let me be direct: I could not have built all this in one day without AI assistance.
The combination is remarkable:
- SwiftUI provides high-level UI abstractions—no manual layout code, no view lifecycle management
- Swift is expressive and safe—optionals prevent crashes, async/await simplifies concurrency
- macOS offers mature APIs—WKWebView, NSMenu, keyboard handling just work
- Claude Code accelerates everything—generating boilerplate, suggesting approaches, catching errors
But AI alone isn’t enough. My experience in programming, engineering, and product design gave me confidence to:
- Know when an approach won’t scale (SwiftUI Text for large code)
- Recognize the elegant solution (browser rendering browser source)
- Prioritize features that matter (Network timing over WebSocket frames)
- Ship something useful, not something perfect
The Result
Flakes now has lightweight, integrated DevTools:
- Console: Instant access to logs, errors, warnings
- Source: Syntax-highlighted HTML with search
- Network: XHR, Fetch, and document request tracking
- Elements: DOM tree with styles and box model
Safari’s Web Inspector remains available for power users needing breakpoints, performance profiling, or deep debugging. Our DevTools serve the 80% case—quick checks without leaving the browser.
Closing Thoughts
The best tools are opinionated. Chrome DevTools is perfect because the Chrome team made thousands of decisions about what developers need. Safari’s feels abandoned because those decisions weren’t made—or were made poorly.
Building Flakes’s DevTools forced me to answer: what do I actually need? The answer was simpler than Chrome, more integrated than Safari, and uniquely ours.
AI made it possible to explore options rapidly. Experience made it possible to choose wisely.
Flakes is fast, native, keyboard-first smart browser for macOS. https://github.com/chagel/flakes